
Splunk: The Basics Walkthrough
Learning the fundamentals of Splunk and explore its features and working.
Splunk Components
Splunk has three main components: Forwarder, Indexer, and Search Head. These components work together to help us search and analyze the data. These components are explained below: 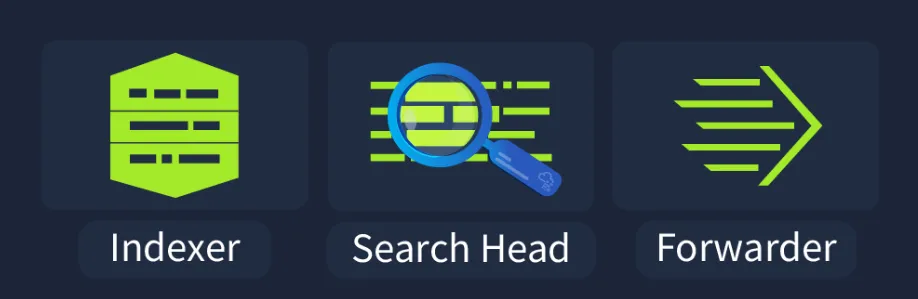
Splunk Forwarder
Splunk Forwarder is a lightweight agent installed on the endpoint intended to be monitored, and its main task is to collect the data and send it to the Splunk instance. It does not affect the endpoint’s performance as it takes a few resources to process. Some of the key data sources are:
- Web server generating web traffic.
- Windows machine generating Windows Event Logs, PowerShell, and Sysmon data.
- Linux host generating host-centric logs.
- Database generating DB connection requests, responses, and errors.
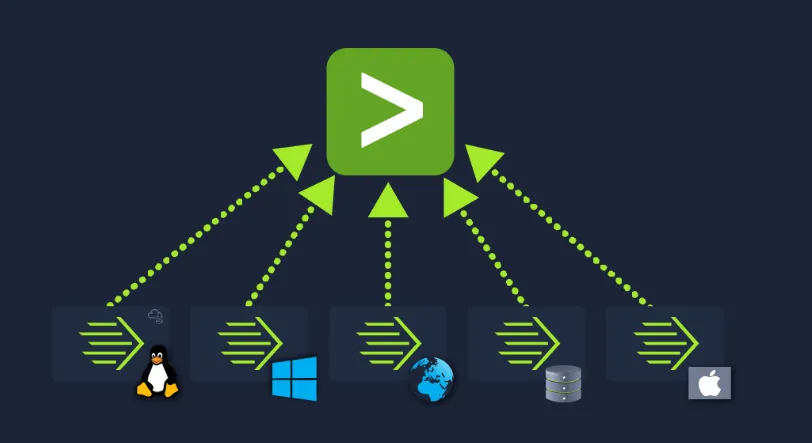 The forwarder collects the data from the log sources and sends it to the Splunk Indexer.
Splunk Indexer
Splunk Indexer plays the main role in processing the data it receives from forwarders. It parses and normalizes the data into field-value pairs, categorizes it, and stores the results as events, making the processed data easy to search and analyze.  Now, the data, which is normalized and stored by the indexer, can be searched by the Search Head.
Search Head
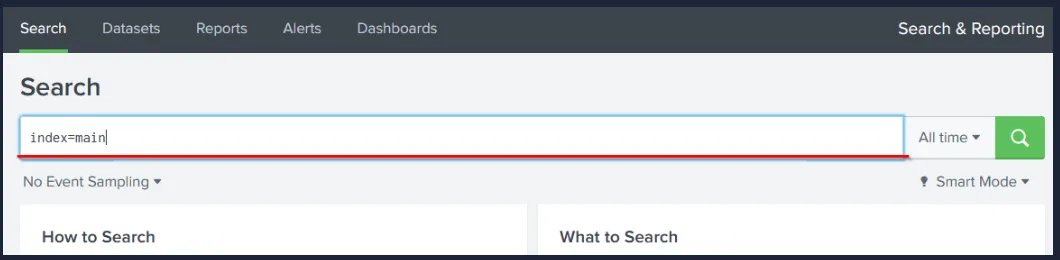
Splunk Search Head is the place within the Search & Reporting App where users can search the indexed logs, as shown below. The searches are done using the SPL (Search Processing Language), a powerful query language for searching indexed data. When the user performs a search, the request is sent to the indexer, and the relevant events are returned as field-value pairs.
The Search Head also allows you to transform results into presentable tables and visualizations such as pie, bar, and column charts, as shown below: 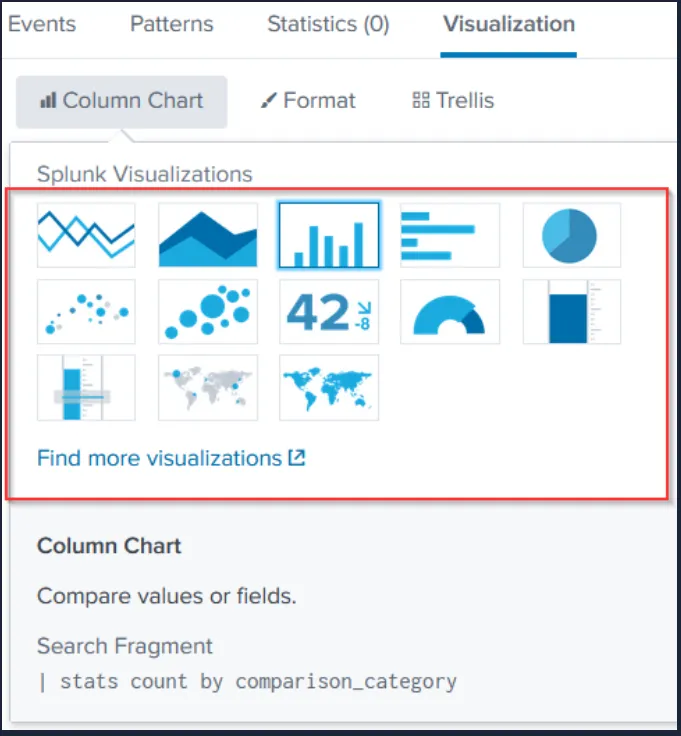
QUESTIONS:
Which component is used to collect and send data over the Splunk instance?
Answer: Forwarder
Navigating Splunk
When you access Splunk, you will see the default home screen as shown below: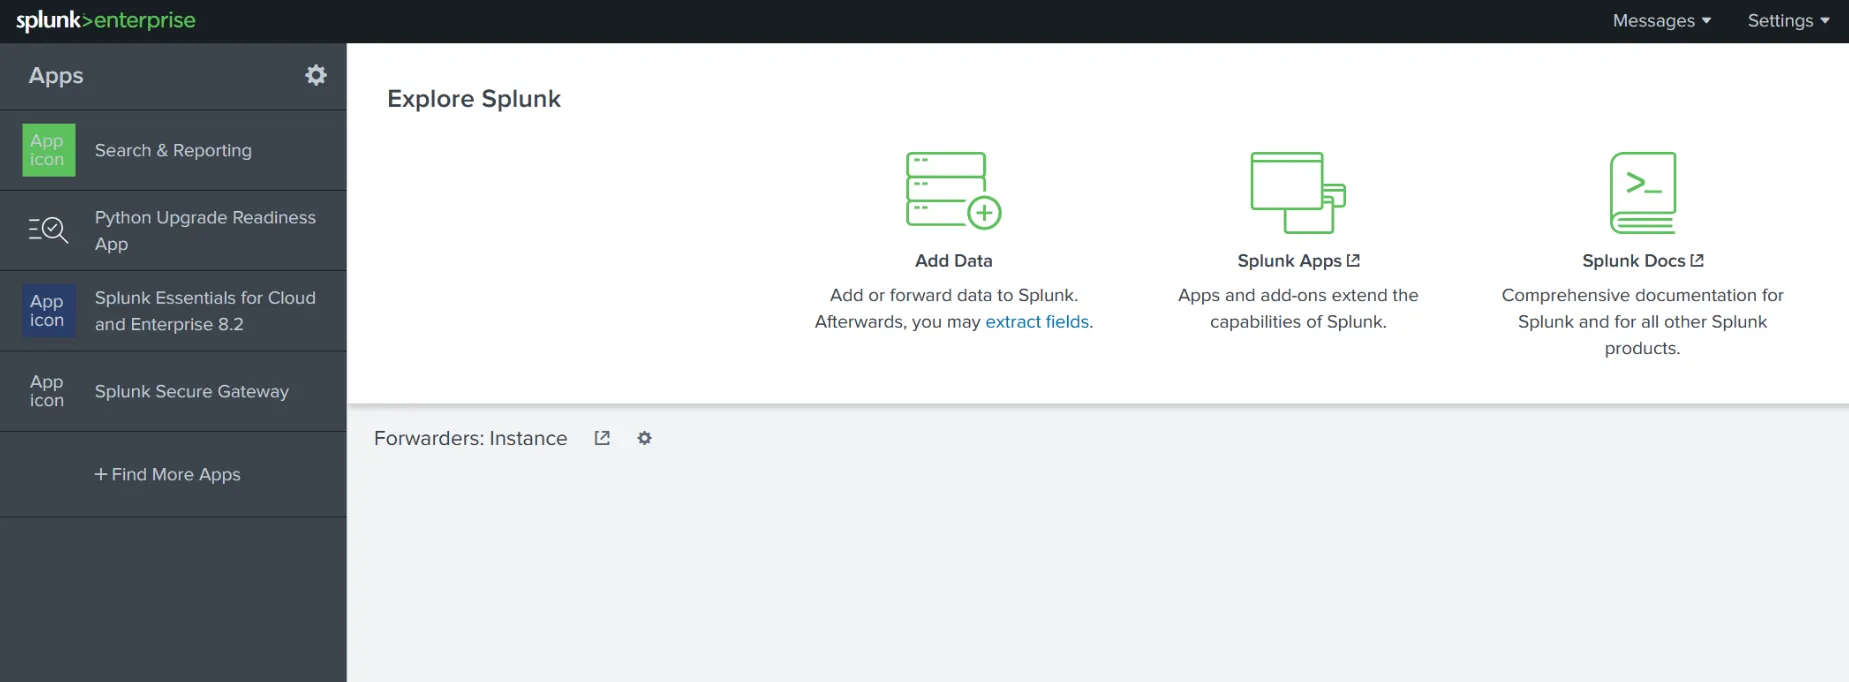 Let’s look at each section of this home screen.
Splunk Bar
The top panel is the Splunk Bar as shown below:
In the Splunk Bar, we have the following options available:
- Messages: View system-level notifications and messages.
- Settings: Configure Splunk instance settings.
- Activity: Review the progress of search jobs and processes.
- Help: View tutorials and documentation.
- Find: Search across the App.
The Splunk Bar, allows users to switch between installed Splunk apps instead of using the Apps panel.
Apps Panel
Next is the Apps Panel. This panel shows the apps installed for the Splunk instance. The default app for every Splunk installation is Search & Reporting. 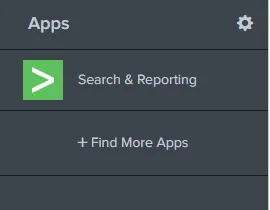
You can also switch between the Splunk Apps directly from the Splunk Bar, as shown below, without using the Apps Panel.

Explore Splunk
The next section is Explore Splunk . This panel contains quick links to add data to the Splunk instance, add new Splunk apps, and access the Splunk documentation. 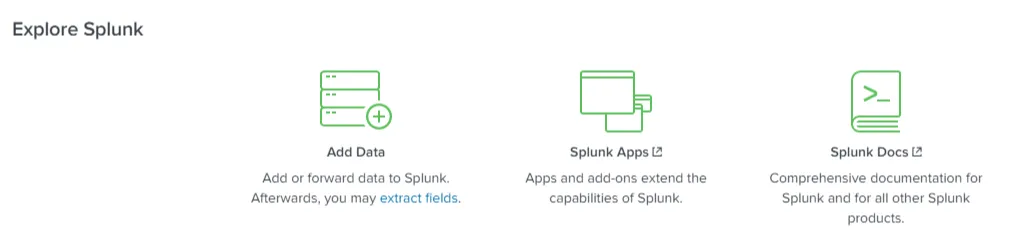
Splunk Dashboard
The last section is the Home Dashboard. By default, no dashboards are displayed. You can choose from a range of dashboards readily available within your Splunk instance. You can select a dashboard from the dropdown menu or by visiting the dashboards listing page. You can also create dashboards and add them to the Home Dashboard. The dashboards you create can be viewed separately from the other dashboards by clicking on the Yours tab.
QUESTIONS:
In the Add Data tab, which option is used to collect data from files and ports?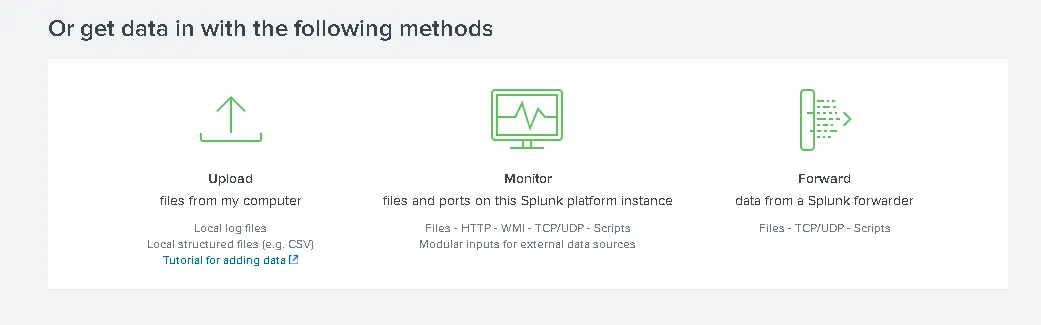 Answer: Monitor
Adding Data
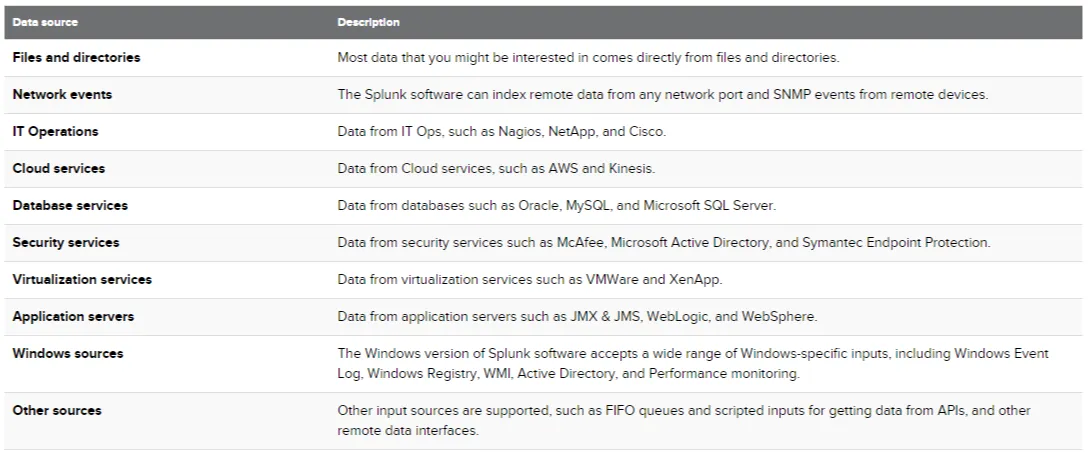
Splunk can ingest any data. According to the Splunk documentation, when data is added to Splunk, the data is processed and transformed into a series of individual events. The data sources can be event logs, website logs, firewall logs, etc. The data sources are grouped into categories.
Below is a chart listing from the Splunk documentation detailing each data source category.
In this task, we’re going to focus on VPN logs. We’re presented with the following screen when we click on the Add Data link on the Splunk home screen.
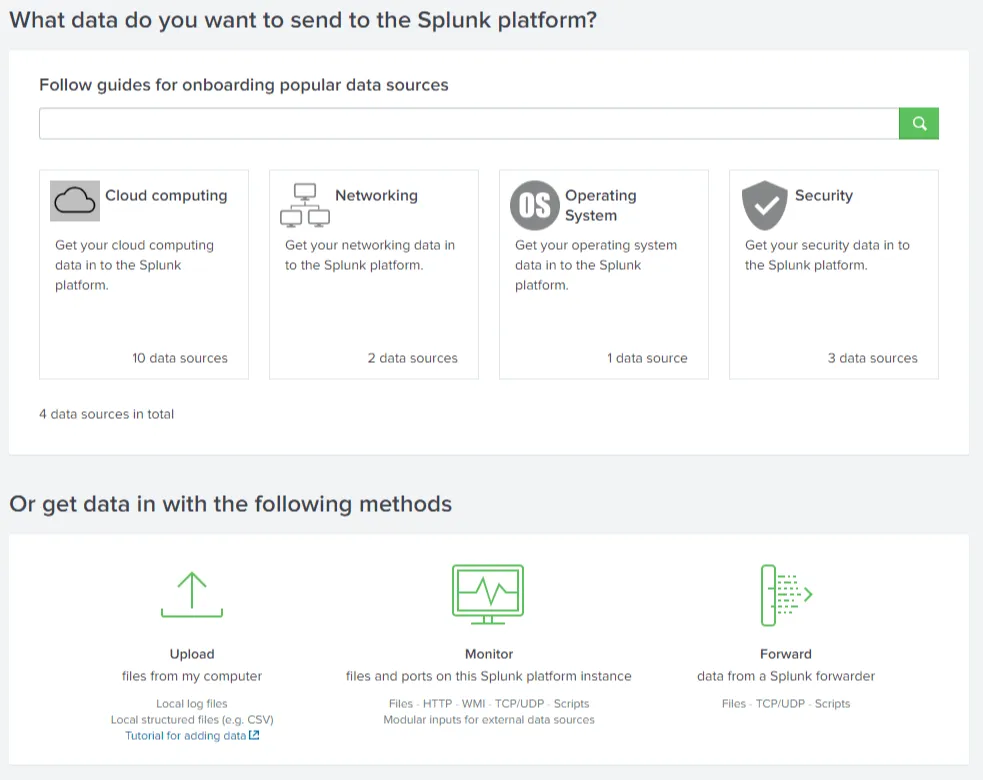 We will use the
Upload Option to upload the data from our local machine.
Practical
To upload the data successfully, you must follow five steps, which are explained below:
- Select Source: Choose the Log file and the data source.
- Select Source Type: Select what type of logs are being ingested, e.g, JSON, syslog.
- Input Settings: Select the index where these logs will be dumped and the HOSTNAME to be associated with the logs.
- Review: Review all the configurations.
- Done: Complete the upload. Your data will be uploaded successfully and ready to be analyzed.
Import settings
The downloaded VPN_logs file is newline-delimited JSON. Use the Splunk upload wizard so Splunk treats each line as one event.
- Open Add Data and choose Upload.
- Select the downloaded
VPN_logsfile. - Keep the JSON source type detected by Splunk.
- On Input Settings, create or select the index
VPN_Logs. - After the upload completes, open Search & Reporting and set the time picker to All time.
If the field names do not appear in search results, add | spath after the base search. That tells Splunk to parse the JSON fields from each event.
Useful checks
Use these searches to check your import before answering the questions:
index=VPN_Logs| stats countindex=VPN_Logs| spath| search UserName="Maleena"| stats countindex=VPN_Logs| spath| search Source_ip="107.14.182.38"| stats values(UserName) as UserName countindex=VPN_Logs| spath| search Source_Country!="France"| stats countindex=VPN_Logs| spath| search Source_ip="107.3.206.58"| stats countQUESTIONS:
Upload the data attached to this task and create an index “VPN_Logs”. How many events are present in the log file?
We can just see the events in top left.  Answer: 2862
How many log events are captured by the user Maleena?
We can add the following expression: UserName=Maleena Answer: 60
What is the username associated with IP 107.14.182.38?
We can add Source_ip=“107.14.182.38” as an expression.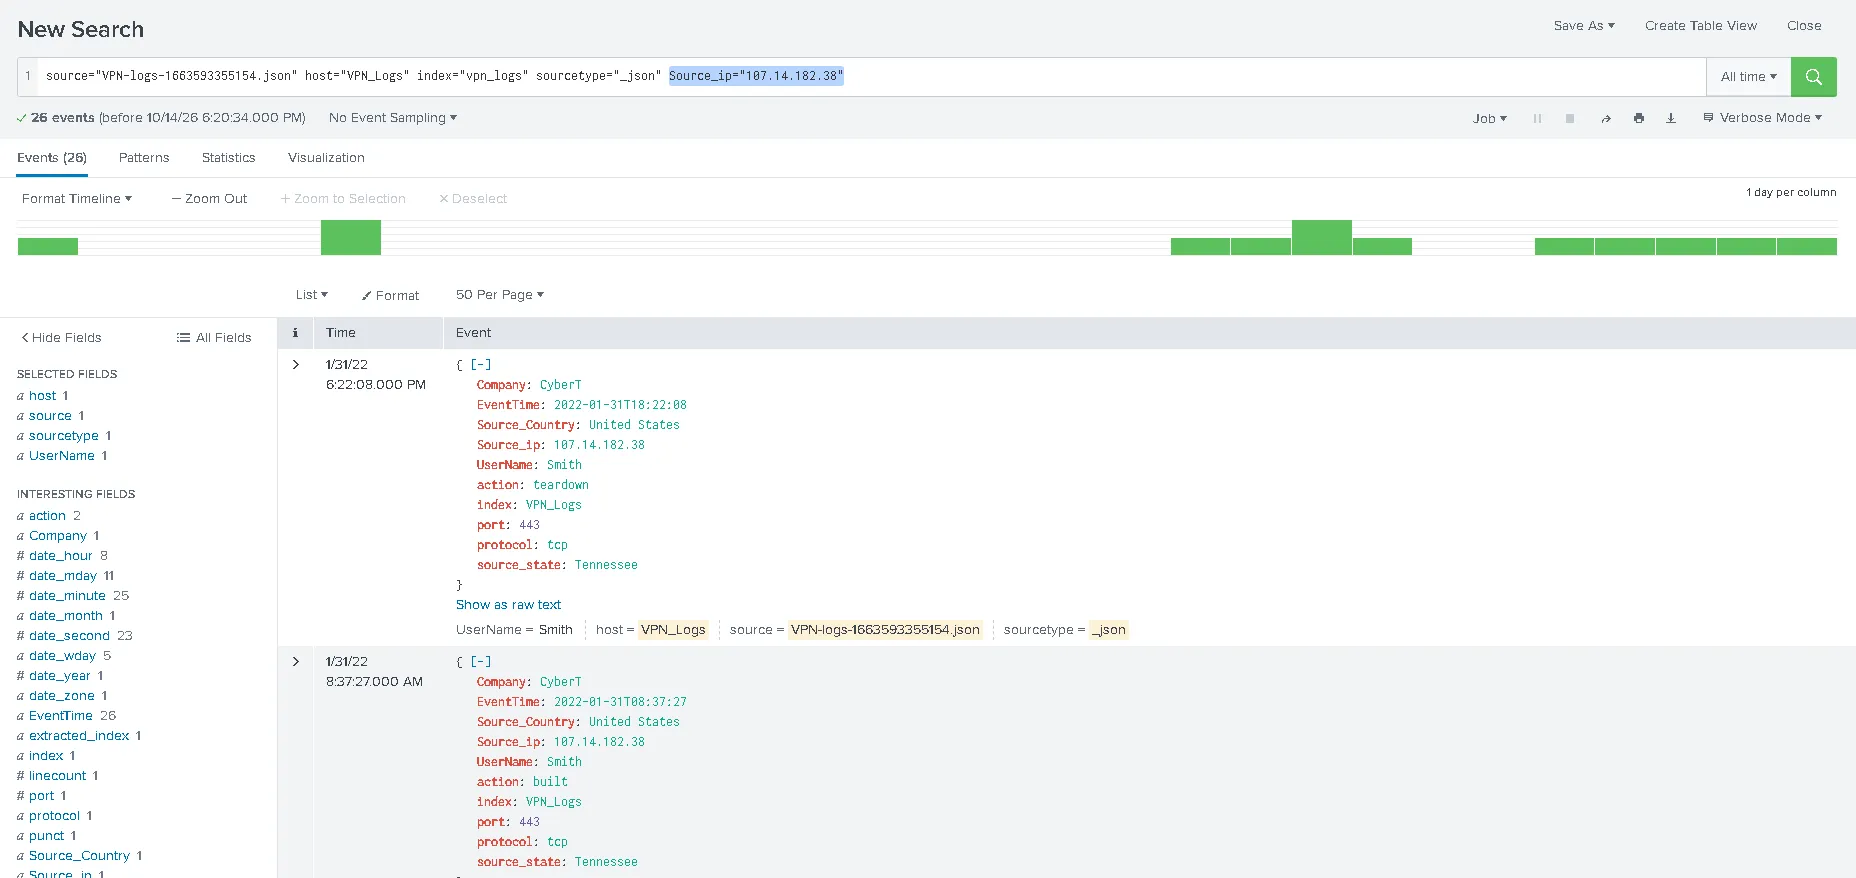 Answer: Smith
What is the number of events that originated from all countries except France?
The expression added would be Source_Country!=“France” Answer:
How many VPN events were associated with the IP 107.3.206.58? The expression needed is Source_ip=“107.3.206.58” Answer: 14